

Why Do ISS Recommendations “Against” Say on Pay Spike in June?
Key Takeaways
- The rate of ISS recommendations “Against” say-on-pay proposals peaks in June.
- The causes of spikes in “Against” recommendations for June meetings are unclear.
- The findings give rise to questions as to why the “June Phenomenon” occurs.
Introduction
Proxy season is underway for most US-based publicly traded companies, with April, May, and June representing the busiest months of the year for annual meetings. This is also ISS’s busy season, over which it publishes thousands of reports. For boards of directors, ISS recommendations are of keen interest, and many appreciate being apprised of broader trends in voting results of key peers and in the general market.
Most compensation committees (and compensation consultants) also pay close attention to the rate of “Against” recommendations issued by ISS on the Advisory Vote on Executive Compensation, better known as say on pay (SOP). The impact of ISS’s recommendations is significant: An “Against” recommendation on SOP routinely lowers shareholder votes in favor by 20% to 30%.
ISS “Against” recommendations for Russell 3000 companies fell in 2024 versus the prior several years to ~11%, below the ~12% long-term average going back to the inception of SOP votes and corresponding ISS recommendations in 2011. As of April 30, 2025, the ISS “Against” rate is low: ~7%.
The low rate of ISS “Against” recommendations could give some sense of relief to boards with meetings in May and June, but history shows us that the mid-proxy season results may be deceiving.
In fact, as much as there is a seasonality to proxy filings and annual meetings, there seems to be seasonality to ISS recommendations. Exequity analyzed SOP voting results and ISS “Against” recommendations month by month from 2011 to 2024. [1] The data indicates that companies with annual meetings in June are more likely to receive adverse recommendations from ISS than those holding meetings in other months.
The June Phenomenon
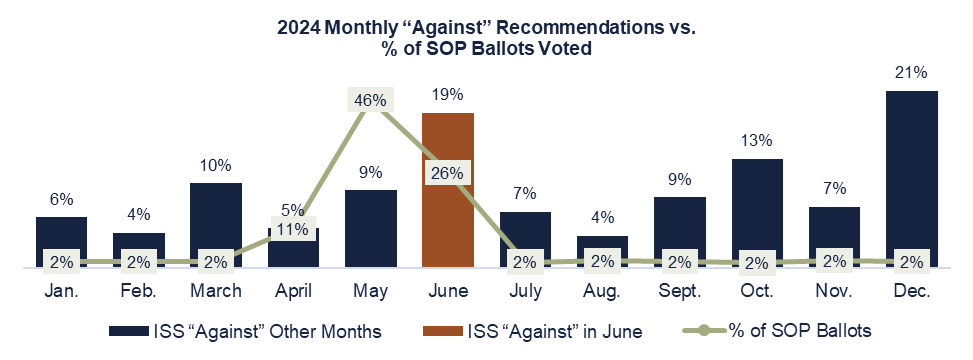
Consider the following from the ~2,500 SOP votes from Russell 3000 companies occurring in 2024:
- At meetings held between January and May 2024 (63% of all 2024 meetings), ISS recommended “Against” 8% of SOP ballots. In June (26% of meetings in 2024), ISS recommended “Against” 19% of SOP ballots … more than double the rate in January through May.
- June “Against” recommendations represented 43% of all adverse recommendations from ISS for 2024, despite representing just 26% of SOP ballots. ISS issued as many “Against” recommendations in June as it did in all of April and May, when 57% of SOP ballots were voted.
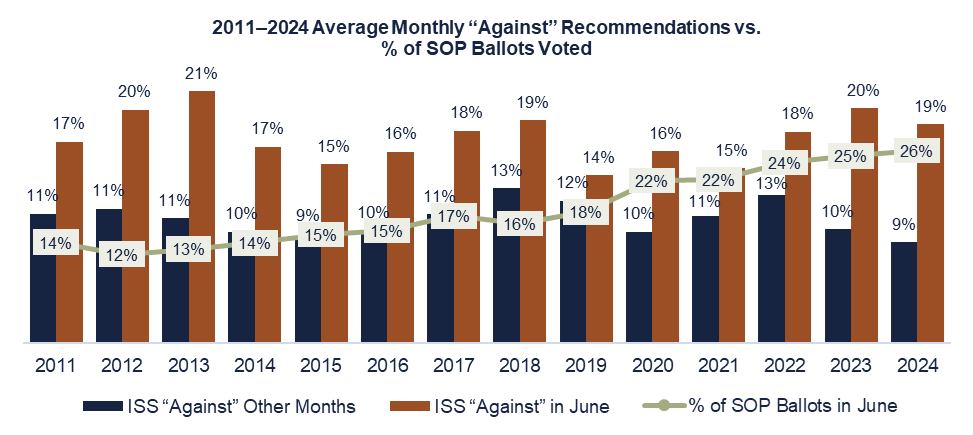
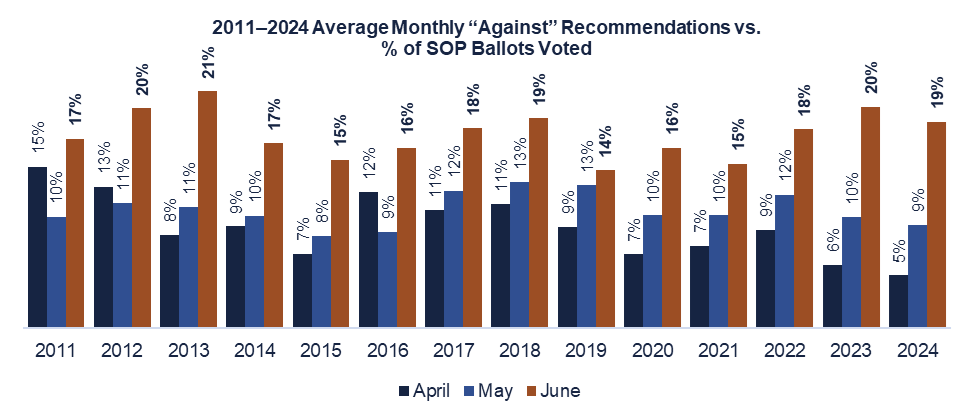
This same trend holds when looking at the average statistics over time. Between 2011 and 2024:
- The average annual rate of “Against” recommendations for January through May was 10% and July through December 13%.
- The average annual rate of “Against” recommendations in June was 18%.
- This trend holds on an annual basis despite the dates of annual meetings slowly shifting away from April and into June over the period measured (~14% of meetings in June 2011 versus 26% in June 2024).
- Smaller spikes in March and December are notable, but the impacts less meaningful (fewer meetings).

Reviewing this same data on a year-by-year basis and comparing June to other months yields a similar pattern—June is consistently higher than other months.
Analysis
Exequity sought to identify potential causes for the June Phenomenon, exploring several possibilities.
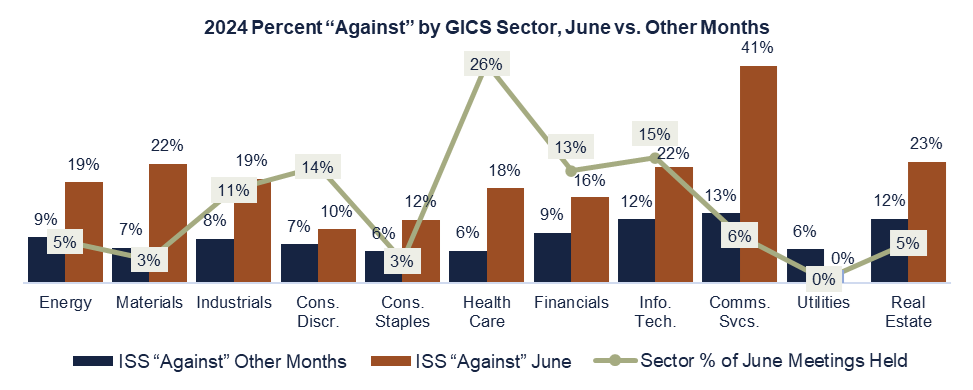
Industry
One potential explanation is industry variation. To test this, we analyzed results in June versus other months, also noting the frequency of annual meetings in June in the event companies in industries prone to “Against” recommendations happened to hold a significant number of meetings that month. On review, we find the June Phenomenon is present across GICS sectors as well—even for GICS sectors seemingly more prone to “Against” recommendations than others (e.g., Communications Services). Though there may be some isolated industry anomalies, it is unlikely that industry differences alone explain the trend.
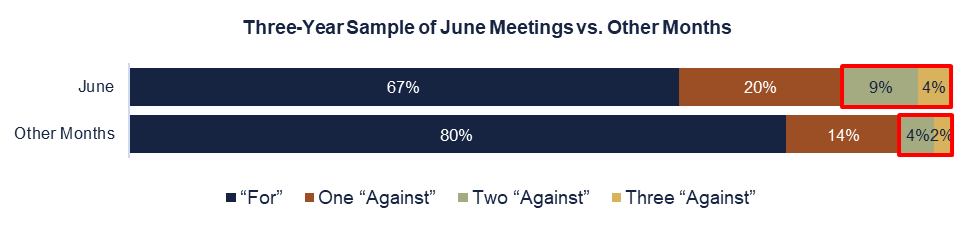
“Repeat Offenders” in June
Another possibility is that companies holding annual meetings in June happen to engage in practices ISS disfavors, resulting in a higher concentration of consecutive “Against” recommendations. To test this, we analyzed the past three years of voting recommendations using a sample of nearly 1,700 companies [2] from among the broader Russell 3000 population to find those with two or three “Against” recommendations from ISS. We compared these to companies receiving one recommendation “Against.” If the instances of a single recommendation “Against” are no greater in June than other months, and “repeat offenders” are highly concentrated in June, that may explain the June Phenomenon.
While there is a slightly higher percentage of “repeat offenders” in June, the trend holds for “single offenders” as well. The increase in single “Against” recommendations is 6% higher in June than other months, and the increase in “repeat offenders” is 7% higher. These figures are in line with the broader trend of higher “Against” recommendations in June. In all, over the three-year period, 33% of June companies received at least one “Against” versus 20% in other months. “Repeat offenders” alone are not causing the spike in June “Against” recommendations.
Pay and Performance
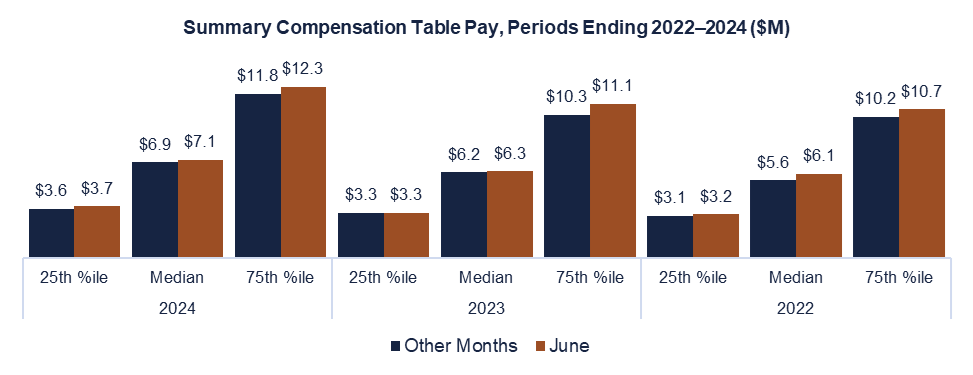
Pay and performance are the inputs to ISS’s quantitative tests, specifically CEO compensation and total shareholder return (TSR). The presence of a “disconnect” between CEO pay and TSR increases the probability of adverse SOP vote recommendations. It is possible that there is a high concentration of high-paying and low-performing companies holding annual meetings in June that could give rise to increased frequency of “Against” recommendations. To test this, we compared pay and three-year TSR performance using a subset [3] of the three-year sample referenced above.
At median, the samples are generally comparable between companies with meetings in June versus other months, though in some instances one subset is higher or lower, likely due to normal statistical variations. Some industries have relatively small sample sizes, but even when samples are larger, the populations have other differences that may impact results. [4]

In all, this data indicates there is unlikely to be a “skew” in which (a) companies with annual meetings in June are predisposed to lower TSR performance than companies with meetings in other months; and (b) companies with annual meetings in June are predisposed to paying more than companies with meetings in other months. Based on these findings, it appears clear that a company’s meeting schedule does not correlate with any given relationship between its pay and performance.
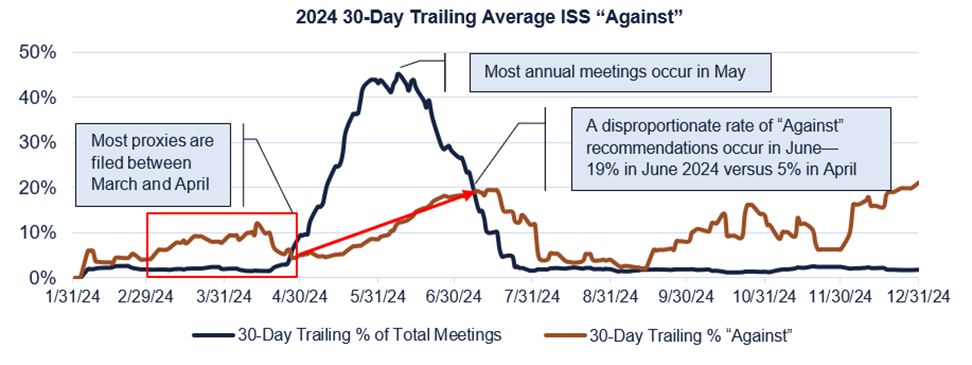
Proxy Season
During proxy season, ISS reports on thousands of companies in a very short period of time for proxies filed mostly in March and April. In 2024, 83% of Russell 3000 SOP votes occurred between April and June (11% in April, 46% in May, and 26% in June). In 2024, there were more than 2,000 SOP votes in these months, and more than 1,100 in May alone.
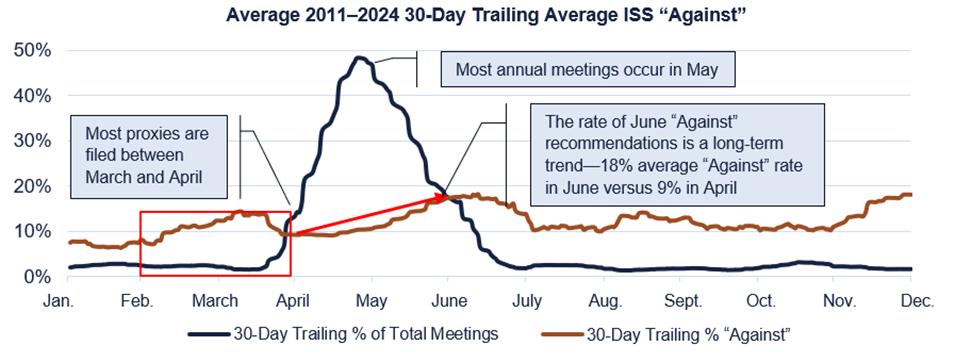
To further analyze this trend, Exequity reviewed 30-day trailing average “Against” rates versus the proportion of annual meetings within that 30-day period. Each year since 2013, “Against” recommendations are lower in April, up slightly in May, and spike in June. June is highest each year since 2011. On average, the percentage of June meeting “Against” recommendations is 8% higher than in April.
This analysis further illuminates the June Phenomenon.
Final Thoughts
The statistics indicate companies have a higher probability of getting an “Against” recommendation by holding annual meetings in June. We cannot determine the reasons companies with annual meetings in June receive a higher proportion of “Against” recommendations from ISS than companies holding meetings in other months of the year. Nonetheless, we observe in the data a trend which repeats itself each year: During each proxy season since 2011, June meetings receive the highest rate of “Against” recommendations from ISS.
ISS recommendations have a significant impact on SOP votes, ranging between 20% to 30% on average. For example, in 2024, the average SOP vote in June was 1.4% lower than in other months of the year, and approximately 40% of the SOP votes failing to garner majority support occurred in June.
The findings raise questions as to why the June Phenomenon occurs.
1 All data was collected from the ISS-Corporate voting analytics database for Russell 3000 companies. Instances of multiple SOP ballots reported in the database (e.g., due to a proxy context) are eliminated to reflect one ballot per company. (go back)
2 The sample compares companies holding meetings in the same month over each of the three years to reduce statistical noise from companies changing meeting months over the three-year period. The percentage of meetings in June in the sample is consistent with the Russell 3000 population (22% and 24%, respectively). (go back)
3 Pay is calculated based on the highest Summary Compensation Table value reported in each year as reported by S&P Capital IQ (presumed to be CEO pay). Pay and TSR are calculated for companies with fiscal year-ends in December, only to provide a consistent comparison. The total sample is 1,193 companies. (go back)
4 For example, the Consumer Discretionary sector has just 22 June meetings versus 111 meetings in other months. The Health Care group is more robust, but the TSR statistics may be impacted by the higher concentration of smaller (more risky) companies. The median revenue of the June Health Care sample is ~$330M versus ~$2.4B for the companies in other months, i.e., we do not have an “apples to apples” comparison. In contrast to the Health Care companies, the Consumer Discretionary groups are, in fact, more comparable. The median revenues of the June companies are ~$3.7B versus ~$4.3 for the other group, i.e., it is a more “apples to apples” comparison. (go back)
Distribution channels: Education
Legal Disclaimer:
EIN Presswire provides this news content "as is" without warranty of any kind. We do not accept any responsibility or liability for the accuracy, content, images, videos, licenses, completeness, legality, or reliability of the information contained in this article. If you have any complaints or copyright issues related to this article, kindly contact the author above.
Submit your press release